Roja Art Lab 2018
Published: 6 Aug 2018
Roja Art Lab is an annual gathering of international artists in Roja, Latvia. For two weeks they are exploring the context and creating artistic reflections. In this article I will try to summarize my experience at the Roja Art Lab 2018 as I am on the list of 10 participants this time.
The Roja Art Lab residency seemed as a nice turn after the 6 month long Fab Academy course in Barcelona. I arrvied in Riga two days before, on July 20. The next day I went to Estonia to explore the results of two international art residencies there. MAAJAAM is a new media oriented residency space that includes a barn-like makerlab. MoKS is a residency where artists are encouraged to work with the context of the landscape and features of the local environment.
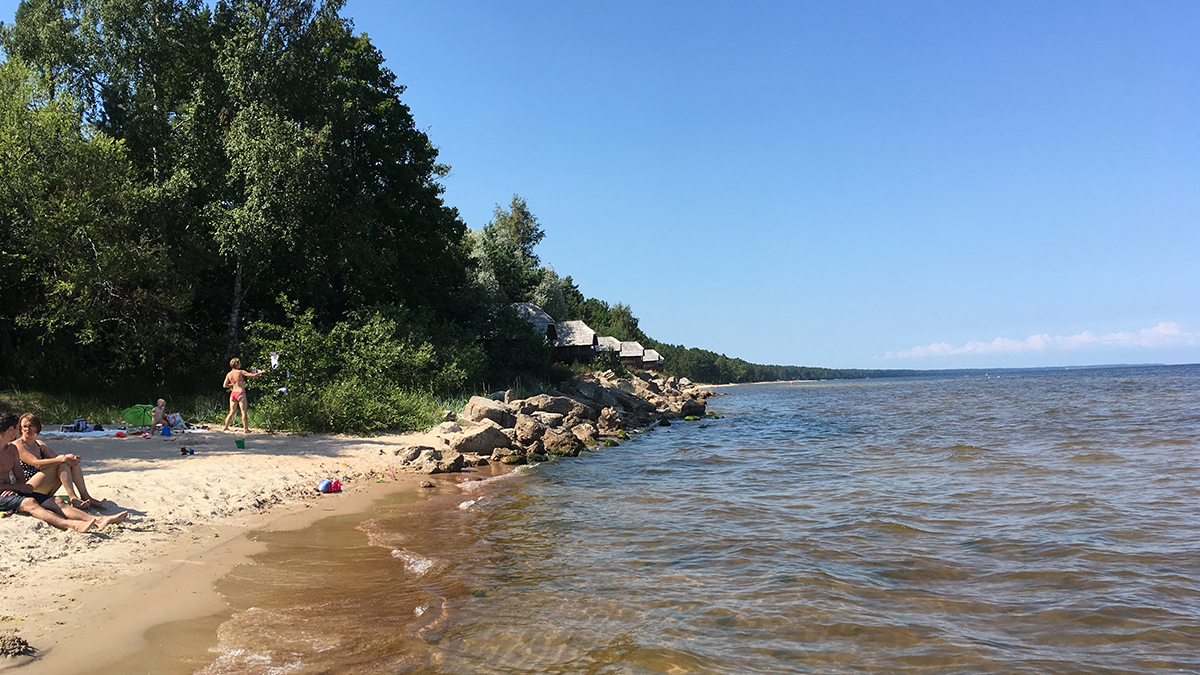
I arrived in Roja on Sunday, July 22. First thing was to visit the Roja Art Lab venue and meet with the host Māris Grosbahs. After receiving instructions and checking in the hotel, I went to the seaside which is exceptionaly beautiful and calming.
I met a part of other artists that came here for the residency. After a brief small talk it was clear that there may be many options for possible collaboration. After a longer conversation during the opening barbecue, I realized that the plan for most of the participants is to do research during the first week and practical work for the rest of the time.
The list of artists includes Enrique Roura, Karla Kracht, Karla Brunet, Darren Ray, Andy Webster, Anthony Stellaccio, Ilze Black and Shu Lea Cheang as a part of Take2030 as well as Agata Engelman.
On Monday we met at 12:30 to visit the mayor of Roja–Eva Kārkliņa. We introduced ourselves and could explore the available rooms in the building of the Roja district council office. After lunch we traveled to see the seaside at Melnsils and the White Dune in Ģipka, all North-West from Roja. Meanwhile Māris showed us the artworks done by participants of previous Roja Art Lab activities.
Research
After helping to set up the internet connection at Roja Art Lab main venue, I decided to do research. Is there data about Roja available on the internet? What can it tell and what meaning can it convey?
I found out that there is a Open Data Portal in Latvia and they even have developer plugins on GitHub. I was looking for data that would include Roja and I found a few. The ones containing the most consistent data set were the income and expenses of Roja County. The relation between collected income tax and its relation to expenses towards education and religion seemed the most interesting for me.
In the meantime I was looking for a place and possible spatial context for the show. Since the digitally fabricated triangular screens it seemed that it would be best to use wilderness as the background for the data-based visuals to stand out. The white geometric surfaces would provide enough reflection to create a feeling of mystery. Anthony, Andy and Darren were planning to place their pieces near to each other and it seemed like a good idea to create a cluster of artworks around the same area. Still I was expecting to keep the feeling of randomness and surprise regarding the location.
An interesting turn in terms of planning and organising work was the announcement that there is going to be a pop-up exhibition on the beach on Friday (27 July) and a longer one starting from Saturday (28 July) at the Roja Info Center. I was planning to leave for a hacker camp in the Lithuanian forests that time. I offered to teach to set up my piece, which would involve projection mapping, and was happy that most of the participants were willing to collaborate.
From the artist talks on Tuesday evening, where both of the Karlas (Karla Kracht and Karla Brunet) were presenting their work, I realized where the enthusiasm comes from. Both of the artists have been using projection mapping in their projects in one way or another. They were all excited that Raspberry Pi minicomputer could be used in their artistic practice.
Exploration
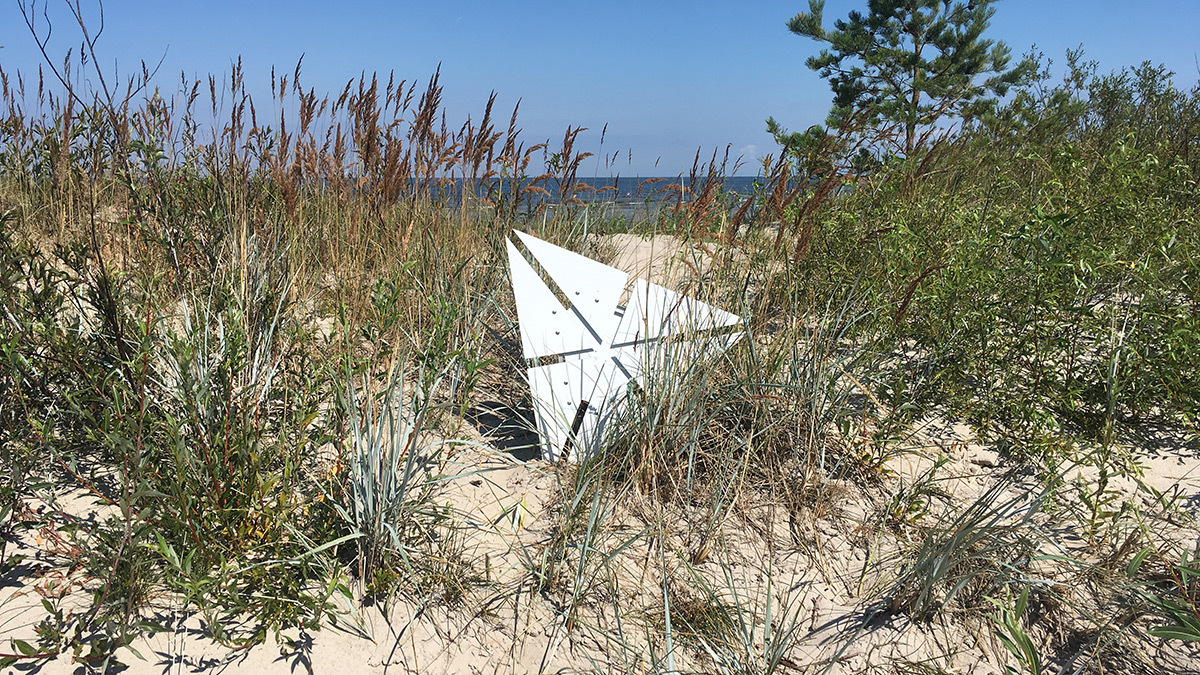
Wednesday was a very warm day and it was hard to find a place for doing computer related work. I decided to take one of my triangle surfaces and walk around to make photos with the surface in different places. Below you can see a shot with the triangle sitting in the sand of the Roja beach and resting against the surrounding vegetation with the Baltic Sea in the background.

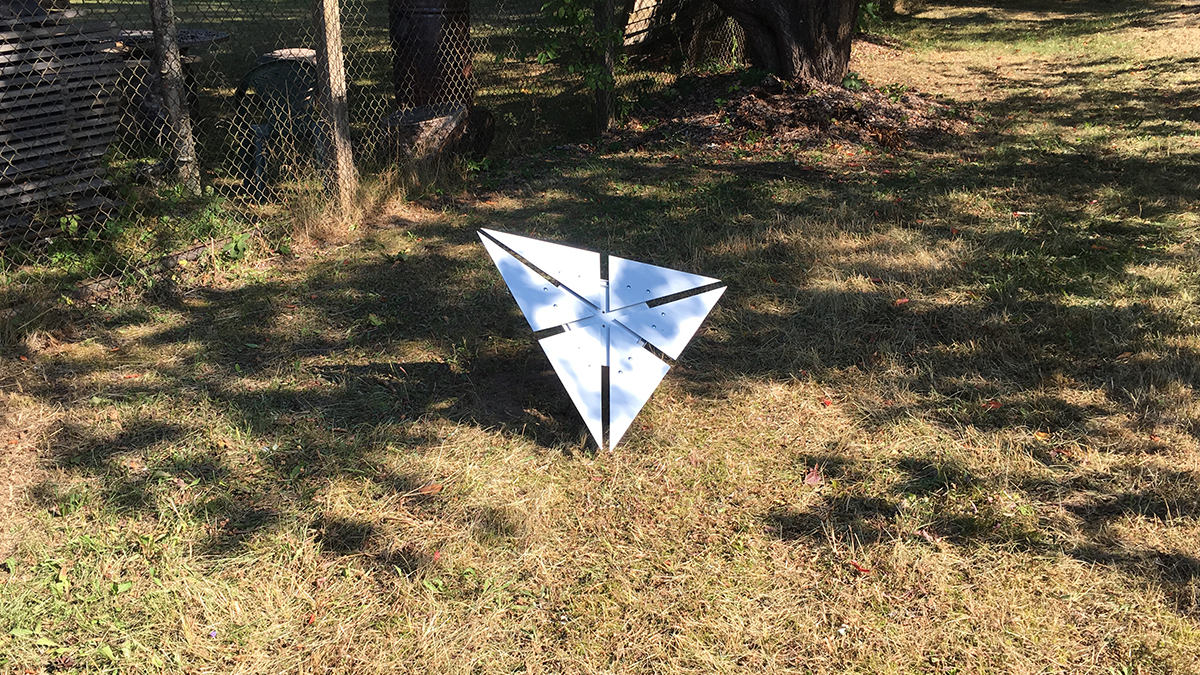
Later I decided to make a field test and found a 10x10cm thick wooden beam that I cut 45deg at the end with a handsaw. I attached one of the triangles to the 45deg cut by using wood screws and dug the other end of the beam into the ground approximately 50cm deep.
To close the first development cycle I had to add the projection layer and map it to the surface. I sarted out with an application that I build as an example for my last projection mapping workshop at Fab14. It features 10 rectangles that bounce off the sides of the screen at random speeds. I added a guide drawing feature to lay out the mapping elements virtually first. I used a 500x500px texture with the precise layout of the surface to use for texture mapping. The generated textures are and will be drawn on a 500x500px canvas as well.
Next step would be transfer the code to a Raspberry Pi and map it on to a real surface. It is planned today that we go to the Roja Information Center to set up our pop-up exhibition. Since I am leaving for two days on Thursday to run a workshop at the No Trolls Allowed hacker camp in Lithuania, I will have to show the other participants how to adjust the mapping if it goes wrong.
I was back on Sunday evening with a bag full of inspiration. Additionally to running a minimal version of the projection mapping with the Raspberry Pi workshop I joined lectures and learned basics of GLSL shader language as well as did functional programming experiments with C++.
Battery Test
On Tuesday I went to Talsi (closest city with an electronics store) to look for a motorbike battery. I went to several stores and ended up buying a 12V children car battery with 19AH capacity. I designed a simple bash script to test how long the system runs.
@reboot echo "BOOT $(date)" >> "/home/pi/boot.log"
* * * * * echo "ISON $(date)" >> "/home/pi/boot.log"
On boot the time along with the key BOOT would be recorded to the boot.log. Every minute current time would be added to the same file with the key ISON.
BOOT Tue 31 Jul 14:43:21 UTC 2018
ISON Tue 31 Jul 14:44:08 UTC 2018
ISON Tue 31 Jul 14:45:01 UTC 2018
ISON Tue 31 Jul 14:46:01 UTC 2018
...
After I came back from a walk the projector was off. After reading the log file, I found out that the system was on until 16:00. The last boot time before that was 14:43 which means the system was on for 1 hour and 17 minutes.
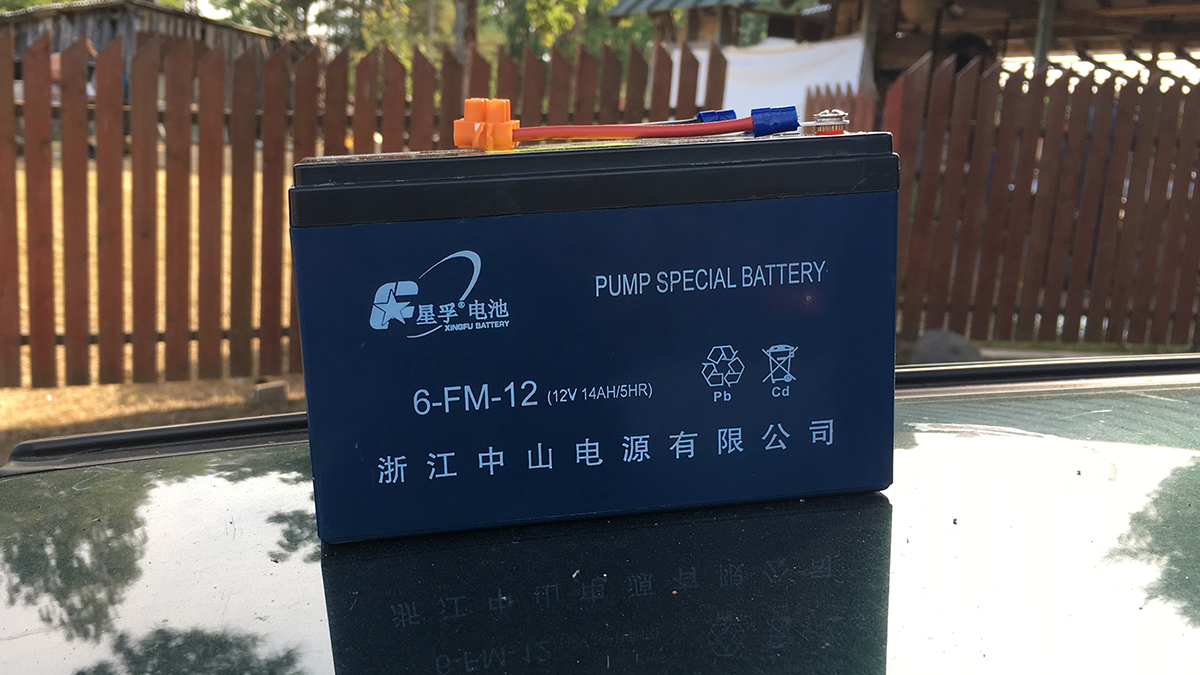
The problem here was that I did not know if the battery is full. I got a car battery charger to charge it during the night in order to try out one more time the next day. The specification of the one I got told me it will take approximately 40 hours to achieve 80% charge.
Later I bought a cheap charger and the estimated charge time for the 14AH battery was 40 hours. I did try to charge it, but did not readh a full charge untill the end of my stay. Thus I did not use the battery at the end as it was possible to get electricity from the grid at the location where I presented my work.
Data
While working on the animation I noticed an interesting fact about the data. When numbers are normalized (translated into values between 0 and 1 using the maximum value in the data set as a reference) things contrary to your assumptions reveal themselves. I realized that expenses towards education almost match and in some years even surpass income generated by the income tax. See below.
Year    Income      Education   Religion
---     ---         ---         ---
2008    0.989083    0.727913    0.408389
2009    0.640882    0.834081    0.386507
2010    0.785822    1.000000    0.228368
2011    0.569786    0.615419    0.12754
2012    0.621657    0.587346    0.176361
2013    0.725099    0.634199    0.176572
2014    0.791658    0.632954    0.147899
2015    0.796871    0.670498    0.149679
2016    0.798377    0.662914    0.161404
2017    0.836357    0.763318    0.443935
in the data extract above you can see that in years 2009, 2010 and 2011 expenses towards education surpass income. In year 2010 the expenses appear to be the absolute maximum number in the data set.
I used audio samples by fractal_dimension on Freesound. Because of time limit as for the first iteration I decided to go with plain playback of samples and the change of speed of playback according to normalized data.
Then I wondered whether it would be possible to use a bluetoth speaker to play back the audio. My question was if it is possible to configure that by using command line tools on a Raspberry Pi. I found a document by GitHub user actuino. The safest option for the moment was to use HDMI connection and play the sound back through the minimal speakers of the projector.
Above you can see a video of a test that I did before the show day. One thing that I may improve in future versions of this would be the use of LED’s on the back to highlight the shape of the projection surface.
Location
Throughout the day the plan for the last day built itself. I decided to set up the object in 3 different locations. One of them would be at the Roja Info Centre, the other at the former fish-related hangar at the sea and the third one near to the Roja Art Lab main venue. I would use power supply from the battery to drive the equipment at the hangar place.
Above you can see a video from within the former fish production hangar at the sea. I decided to put a video loop here since it contributes much more to the mood of being lost somewhere in the zone. At the end I did not use it as my main location, but I placed a copy of the object there.
Concept
I decided to call it the Roadside Object which was partly inspired by a science fiction novel by Arkady and Boris Strugatsky with the name the Roadside Picnic, written in 1971. The story is about locations on earth that have been visited by alien life form and the fact that they left trash that would drive scientific research on earth.
Someone else have visited Roja to leave it. It is not known whether there was a reason for the visitation, but if examined closely, one can notice patterns that reveal data structures about the amount of collected income tax from the inhabitants of Roja and how it relates to expenses towards education and religion by the local government.
Since recently citizens of Latvia have access to open data related to their own country. Data sets cover areas such as health, energy, culture, science and more. It can be accessible through the internet via the address data.gov.lv. This installation is an artistic data exploration with the intention to motivate to review personal methods of forming an opinion and an invitation to take a look at ourselves from far above.
The author, Krisjanis Rijnieks, is a new media artist who explores the possibilities of the modern day media and fabrication technology to create potentially thought-provoking artefacts to penetrate mindsets prone to hatred rooted in grim perception of subjectively-declared absolute truth.
Result
The hardest par was to decide how should the projection part of the piece look like. Since I chose three parameters from the data sets found (Income tax, expenses towards education and religion) it seemed like the number of visual objects should be three as well.
I went with three circles that would change their radius according to the data. I also added text that was showing the change of data in real time. The choice of such a simple geometric shape seemed right because of the interplay between the geometric object and the wild background seemed interesting for me.
I increased the speed of time and turned 9 years into seconds. Interpolation was necessary inbetween the years to increase the feel of the data changing. The movement had to be smooth. Below you can see a video of how the final result looks like.
It might be interesting to some to know exactly how the data is mapped to the movement. For those there are good news since all code is available on GitHub. The rojaLabApp repository contains an openFrameworks application with projection mapping capabilities to be reused, improved or reinterpreted for another context.
Conclusions
I have not been to many artist residencies. The last one was a maker residency at the Chester Beatty Library in Dublin. Also there I did a data-driven projection mapping installation by using open source software and almost open hardware.
This time I went for Roja as I wanted to visit my home country and spend some time in one of the most beautiful parts of it. The fact that I would meet other international artists was very motivating. The challenge of deciding the direction of data research at the location was inspiring. Combining that with my projection mapping experience would be the next step for me.
Two weeks is not a long time to produce a piece, but that can also work as a motivator. In my case I had some things that were ready with me. I had my own equipment and parts from earlier projects that I could reuse. Thus I had time to focus on the data, concept and visual part of the final piece.
There was enough time to solve the conceptual and visual part and I can say that I am sattisfied with the result and feedback from other residency participants and audience. On the practical level I would like to improve my rigging skills. Driving projectors of the grid would be my wish. Doing it for longer periods of time as a part of a permanent installation outdoors would be a long-term chalenge.
If I would not have my fabricated triangluar surfaces with me, I would have to make them by hand or it would be nice to have a portable CNC mill with me. Tooling and methods are an important part in the work I am trying to do. It would not be possible to make this in two weeks without my previous efforts during the past five years.
Support
This project has received support from the State Culture Capital Foundation of Latvia. Thank you!